Firebase Genkit Monitoring: Monitor Your Generative AI Performance
Apr 30, 2025
A few days ago, while testing an application I built with Genkit, I noticed it was taking too long when generating an image with Imagen 3. I wasn't sure if it was an LLM outage, if the model's response time was slower than usual, or if my request had failed before even reaching image generation. While we can easily debug our projects during local development, what happens when we take them to production? How can we monitor their behavior and detect unexpected issues?
Fortunately, when developing my application, I added Firebase Genkit Monitoring and was able to pinpoint the issue. In this article, I will explain what it is and how to configure it in your projects.
Firebase Genkit Monitoring
It is a Firebase feature that provides tools to observe and monitor your Genkit functions directly from the Firebase console. It helps you track usage and understand the health, performance, and behavior of your AI-powered applications in a real-world environment.
At the time of writing, Firebase Genkit Monitoring is in public preview. General availability and features may change in the future.
Genkit is fully instrumented with OpenTelemetry and provides hooks to export telemetry data.
The Google Cloud plugin exports telemetry to Google Cloud's operations suite (Logging, Metrics, and Trace).
Why is Monitoring Important for Generative AI?
Imagine running an application in production and needing to calculate token usage to optimize costs or understand scalability. Or perhaps you face failed calls to large language models (LLMs) and need to identify the root cause, such as connection issues or malformed queries.
This is crucial when generative AI is a core component of your value proposition, as even minimal delays can degrade the user experience and negatively impact your project's long-term success. This is where the ability to observe and analyze the performance of your AI functions becomes indispensable.
What Metrics and Data Does Firebase AI Monitoring Provide?
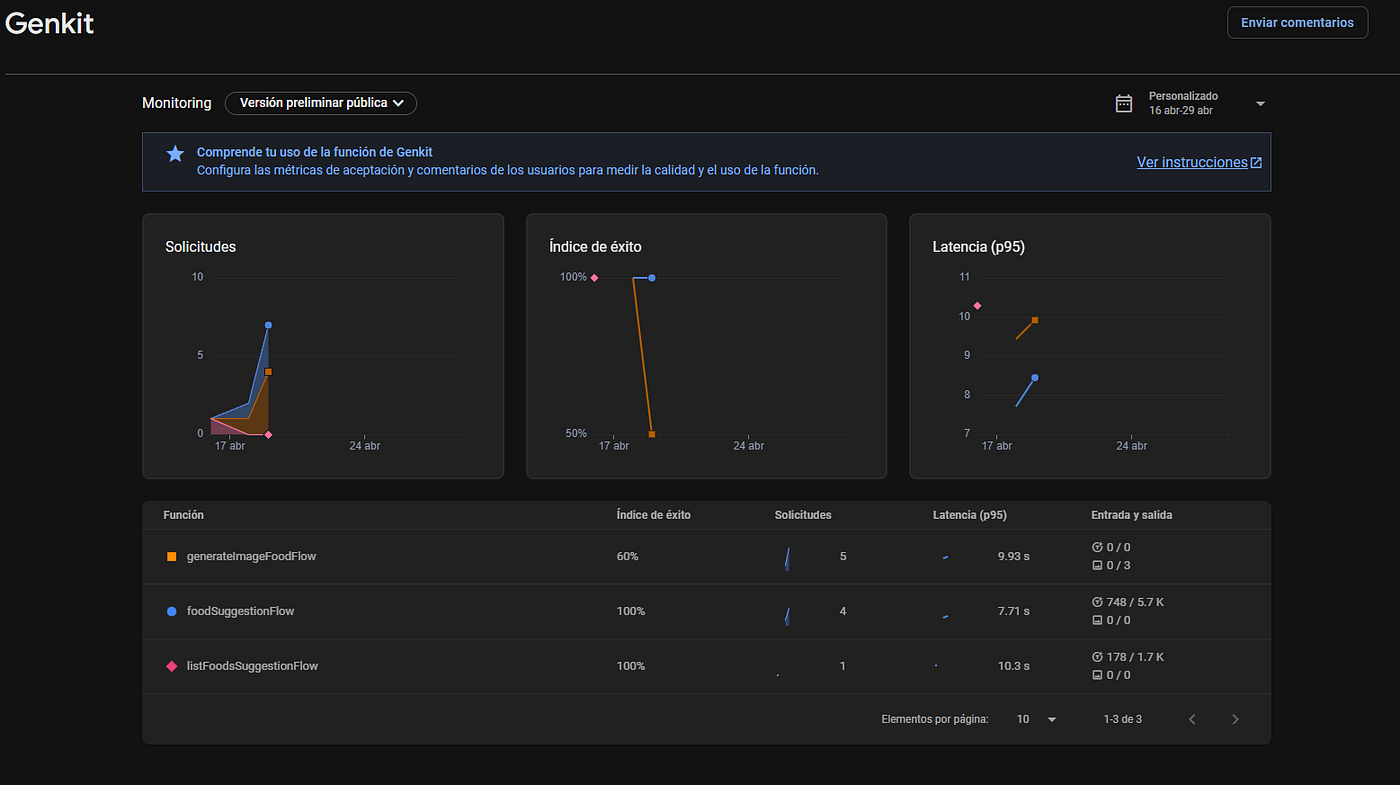
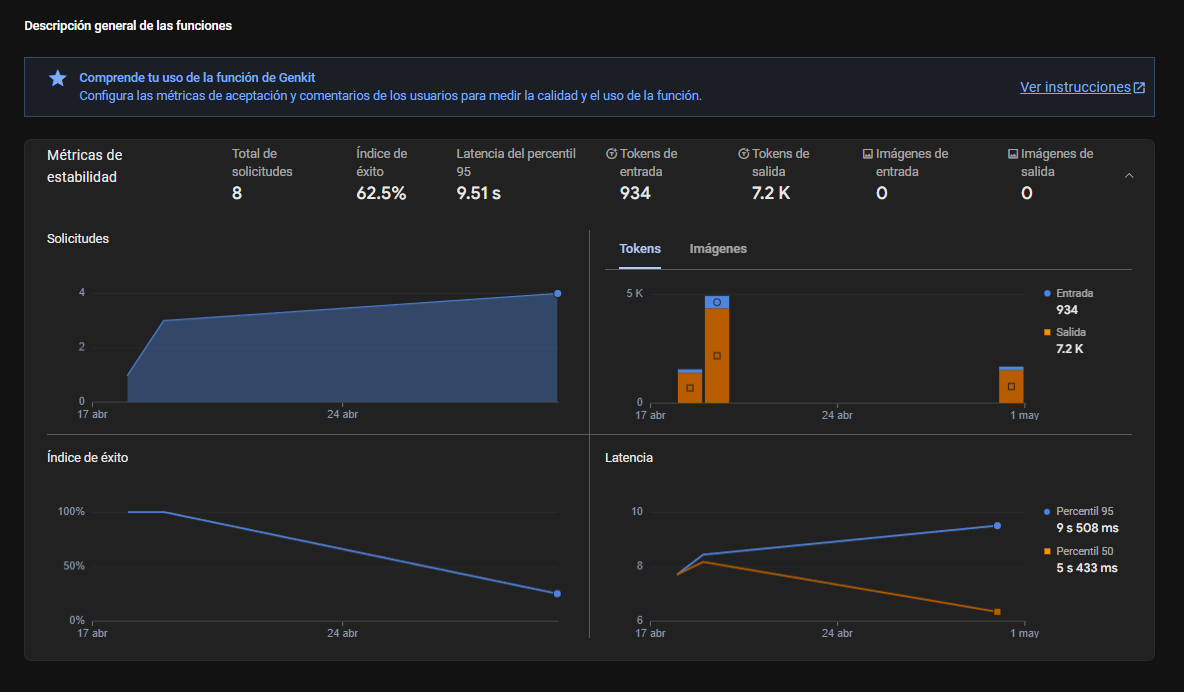
From the Firebase console, you can open the Genkit menu item to view the Genkit AI Monitoring dashboard, which displays charts for usage metrics, success rate, and latency (p95).
- Usage Metrics: helps you understand resource consumption and optimize costs.
- Success Rate: indicates the reliability of your functions and helps identify issues.
- Latency (p95): shows the response time for the 95th percentile of requests, crucial for user experience.
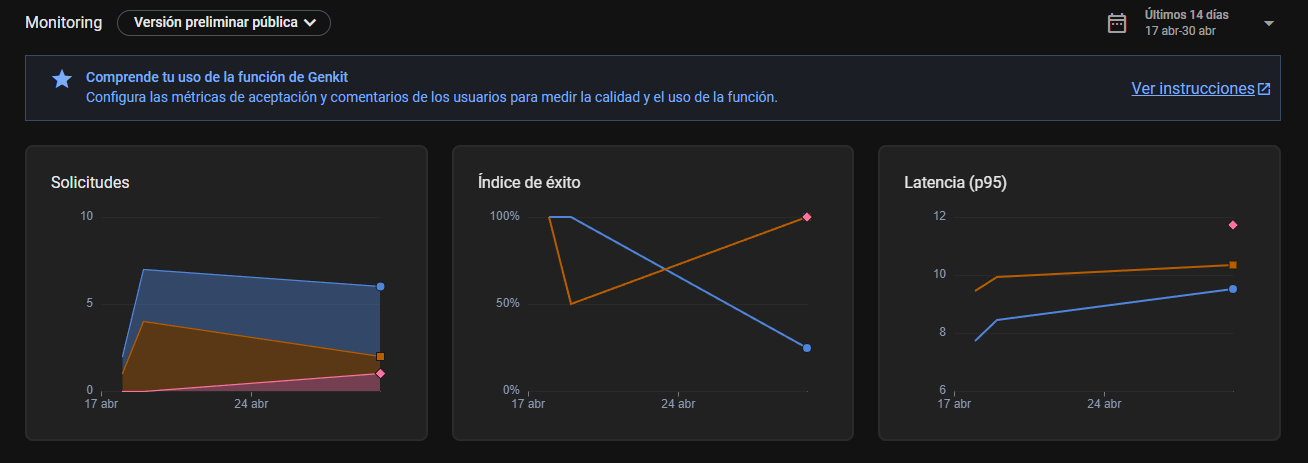
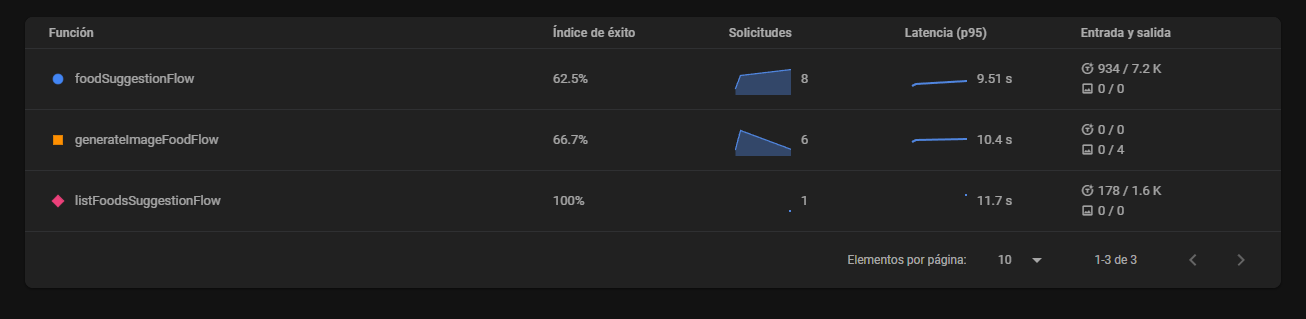
Additionally, if we want to inspect the details of each function, the dashboard provides that information. For example, to check the number of tokens used, we can look at the Input and output column.
Now, if we want to view the details of a specific function, we can click on any of them.
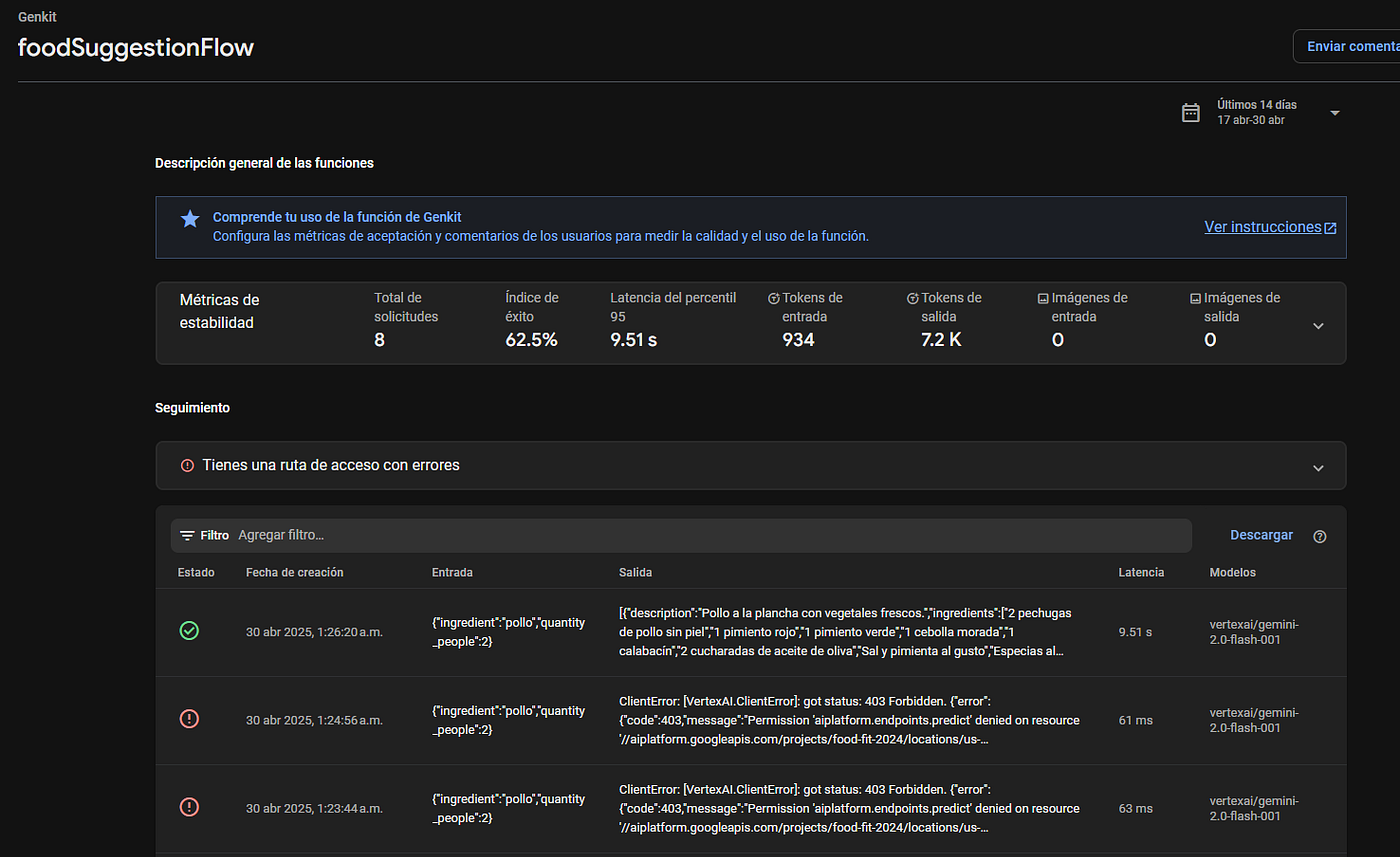
In the Stability metrics section, we can view charts detailing how many tokens we used, at what time our function spiked, and additional insights that can help optimize our project.
If we want to inspect the trace of a model request, we can click on a log entry to see the full details.
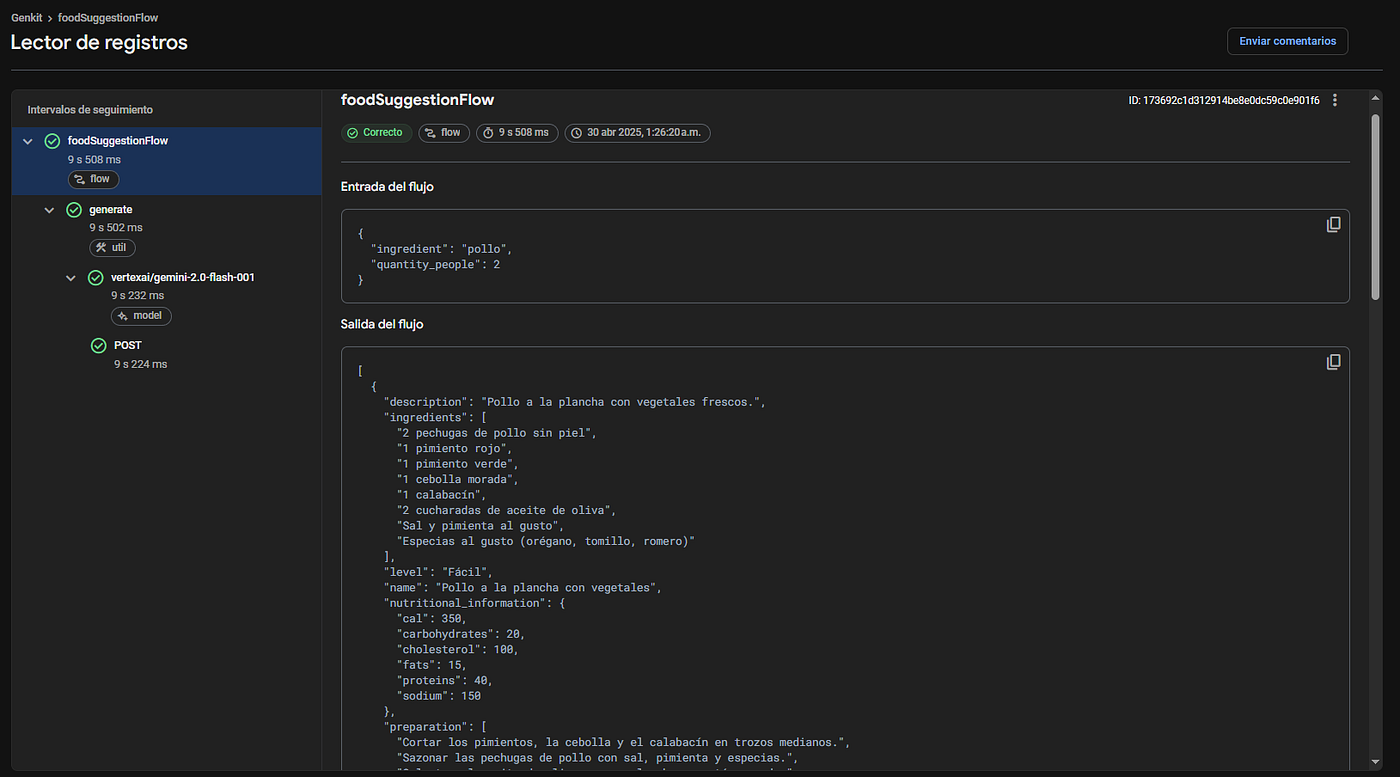
With all this information, we can continuously analyze and improve our functions.
Guide to Using Firebase Genkit Monitoring
To enable AI monitoring in your Genkit application, import the Firebase plugin in your project and configure telemetry as follows:
import { enableFirebaseTelemetry } from '@genkit-ai/firebase';

enableFirebaseTelemetry();
From your Google Cloud project console, make sure these APIs are enabled:
In addition, you must grant a few extra roles to your default Firebase service account:
- Monitoring Metric Writer: provides permissions to send metrics.
- Cloud Trace Agent: allows writing trace data.
- Cloud Telemetry Metric Writer: grants access to write logs.

Finally, redeploy your project to production.
In summary, Firebase Genkit Monitoring is an invaluable tool for any developer working with generative AI in Genkit and Firebase. It provides the visibility needed to understand performance, optimize costs, and troubleshoot issues in production environments.